
When discussing climate change, the atmospheric CO2 concentration frequently emerges as a ubiquitous symbol, appearing in various media outlets, online platforms, and conversations.
The reason is simple:
Energy from the sun hits the surface of the earth, part of this energy is absorbed and heats up the ground, the other part is reflected back towards space.
The ratio between the quantity of energy absorbed and the quantity received is the albedo. The average albedo of the earth is 0.3: 30% of the energy received from the sun is directly absorbed by the surface.
We can then calculate what would be the temperature of the surface of the earth after this process and find... -18°C, far from the observed average of 15°C. Something else must be at play here.
The quantum properties of CO2 allow it to absorb and reemit heat as infrared radiation — that's the greenhouse effect.
Introducing, CO2. The quantum properties of the CO2 molecule allow it to absorb and reemit heat in the form of infrared radiation. Part of the radiation reflected by the ground is thus absorbed by the CO2 present in the atmosphere and sent back towards earth, and the cycle starts again. That's the greenhouse effect.
Once again, taking this process in consideration, we can calculate what should be the temperature of the surface and we find 10°C, that's a 25°C difference! Those few molecules do have a huge effect on global temperature! But we are still 5°C short...
The abundant and concentrated energy obtained from fossil fuels forms the basis of our society's existence.
They have played an integral role in various aspects of our lives. They power our energy production, drive vehicles, enable the production of plastics, electronics, medical equipment, cosmetics, appliances, fibers, building materials, asphalt, paint, lubricants, detergents, ...
Essentially, anything that has been produced on a significant scale, that forms the foundation of our existence, that we take for granted, has been made possible by processes reliant on fossil fuels.
Scientists have long presumed that humans could have an impact on the climate but that's only in the 1950's that progress was made.
That's also when a young PhD student by the name of Charles David Keeling developed instruments to measure the atmospheric concentration of different chemical species. He chose Mauna Loa to deploy his instrument. A place in the middle of the Pacific ocean, far from any pollution.
His observations ran almost without interruption ever since and gave birth to one of the most famous graphs.
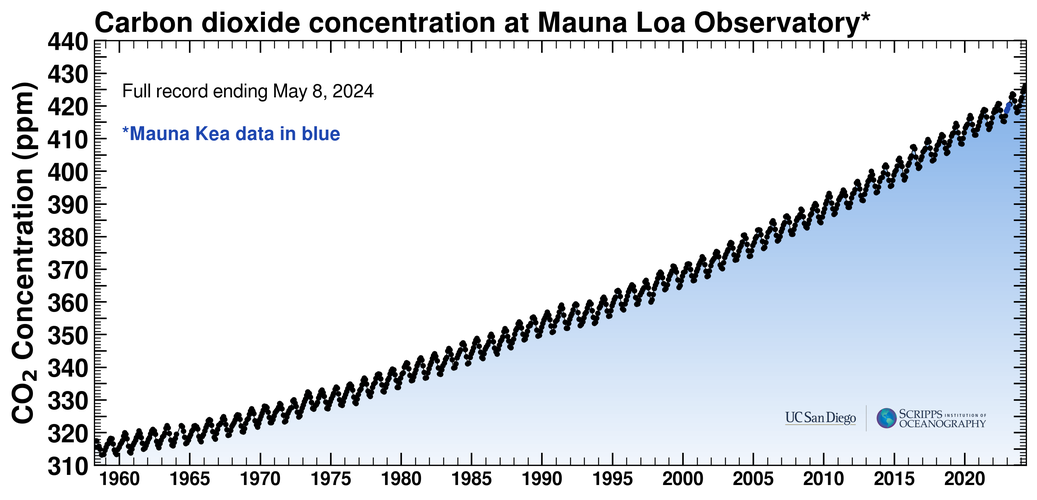
When talking about climate this graph is thrown everywhere, in the media, on internet, in conversation. But what does this graph actually say?
It shows the evolution of the atmospheric CO2 concentration from 1958 to today (all the graphs on this page are updated in real time). We go from between 310 and 320 ppm (parts per million, or how many molecules of CO2 per million molecules of air) in 1958 to more than 425 ppm today.
We also clearly see an annual variation of the concentration with an increase during winter months (from September to May) and a decrease in the summer. This annual variation is due to the vegetation cover in the northern hemisphere where most of the land is situated. Plants are more active and absorb more CO2 in the spring and summer than in winter.
The overall increase is also proportional with the human CO2 emissions. So that's an irrefutable proof of human induced climate change, right?
Well this graph only goes back to the 1950's... What happened before? We know that the earth's climate varied naturally and dramatically with warm periods and ice ages.
To answer this question we will have to go back thousands of years. And we can do that thanks to ice cores.
In 1955, a young Frenchman by the name of Claude Lorius finds an ad on the wall of the University of Besançon in France: “Looking for young students to take part in campaigns for the International Geophysical Year”.
This not-so-explicit message will change the course of his life and his legacy to future generations: The first overwintering expedition in Antarctica, 1 year buried in the ice, him and two companions.
Two years later he comes back for a 100 days, 1400 km raid led by Americans. Discovering a temperature proxy in water isotopes and casually naming a mountain range after his wife.
But it is in 1965, while celebrating the end of a successful campaign with glacier ice cooled whisky that Lorius has an intuition: “The air popping out of the ice in my glass could be thousands of years old.”
The air popping out of the ice in my glass could be thousands of years old.
This was the beginning of Glaciology as we know it today.
Following Claude Lorius's footsteps a dedicated and collaborative effort unfolded to advance the technology for extracting and analyzing ice cores. Scientists and engineers diligently worked together, driven by a shared determination to unlock the secrets held within these frozen archives.
Engineering teams focused on designing drilling equipment capable of navigating the challenging Antarctic conditions while ensuring minimal disturbance to the ice cores. Lightweight yet robust drills were developed, employing thermal drilling techniques to penetrate deep into the ice sheets. These drills were equipped with sensors and control systems to maintain precise drilling parameters and preserve the integrity of the ice cores.
Simultaneously, glaciologists and engineers prioritized the development of preservation techniques to safeguard the delicate structure and chemical composition of the ice cores. Specialized containers and insulation systems were meticulously designed to prevent contamination and facilitate safe transportation from the polar regions to state-of-the-art laboratories.
Within the laboratories, chemists refined their analytical techniques to extract valuable information from the ice cores.
Advanced machinery and instruments were meticulously calibrated to measure various properties, including gas concentrations, isotopic compositions, and chemical markers. These analytical tools provided crucial insights into past climates, enabling the reconstruction of temperature changes, atmospheric compositions, and historical events.
The collective efforts of scientists and engineers yielded an unparalleled wealth of knowledge about Earth's climatic past. Ice cores obtained from diverse regions, such as Antarctica and Greenland, painted a meticulous picture of temperature variations, greenhouse gas concentrations, and natural climate oscillations spanning hundreds of thousands of years.
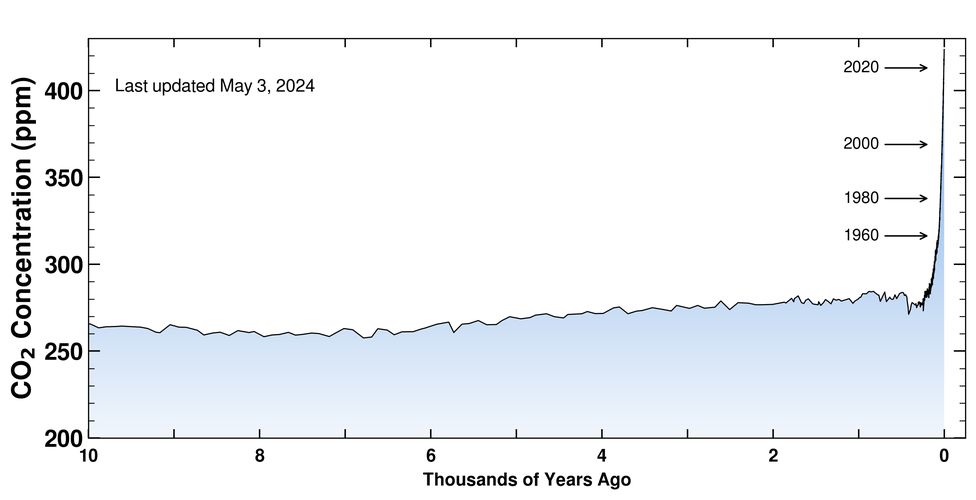
The atmospheric concentration variations observed over the last 10,000 years offer us profound insights into the trajectory of our civilization. Within this timeframe, our world has witnessed remarkable transformations, and recent shifts in atmospheric CO2 concentrations, even if naturally driven, have the potential to fundamentally reshape our way of life.
Over millennia, our civilization has progressed and flourished, marking a period of extraordinary human development. Within this relatively short span of time, we have constructed the foundations of our modern world. From the emergence of ancient civilizations to the rise and fall of empires, we have forged a path of cultural, technological, and societal advancements.
Throughout this epoch, the atmosphere maintained a relatively stable CO2 concentration, providing a backdrop of consistency that supported the growth and progress of our civilization. This equilibrium facilitated the development of agriculture, the establishment of trade networks, and the advancement of science and technology. It allowed us to build complex societies, refine our understanding of the natural world, and lay the groundwork for the interconnected global community we inhabit today.
However, the data present a different narrative. The rapid shifts in atmospheric CO2 concentrations, even if driven by natural forces, have the potential to instigate profound changes.
The ways in which we produce energy, sustain ourselves, the dynamics of our societies, economies, and ecosystems will require significant adaptation.
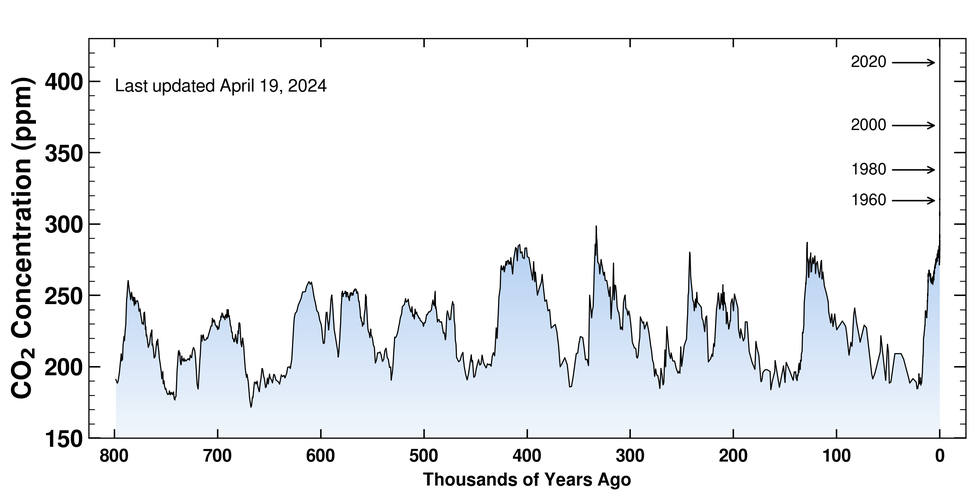
In 1996, the European Project for Ice Coring in Antarctica set out to provide the longest ice-core climate record yet, by drilling a core from 3,270 m thick ice at a site known as Dome C in East Antarctica.